Alabingo Finance Report || Fidelity Bank Shareholders are hopeful of a better dividend at the end of 2017 financial year as the lender surpasses bookmakers’ expectations in third quarter.
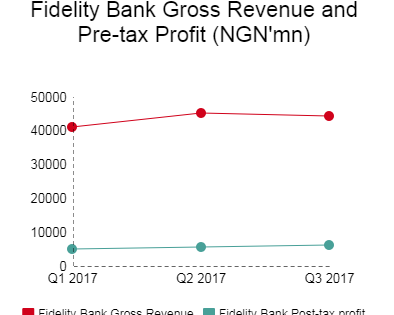
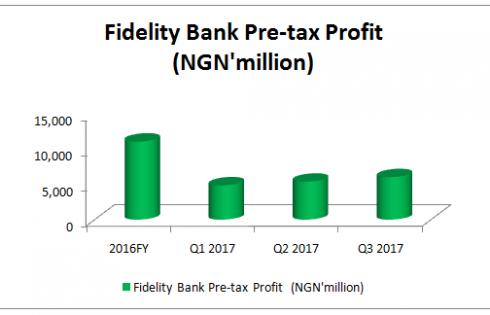
The bank rode on the back of significant improvement in its interest income and treasury bills and other investment securities available for sale to grow post-tax profit 65.09 per cent y-o-y to N14.45 billion in Q3 2017 against N8.75 billion in the reverse period last year.

The recently released Q3 2017 financial statement of Fidelity Bank showed 20.72 per cent increase in interest and similar income to N110.37 billion, which was driven majorly by 72.11 per cent rise in revenue from treasury bills and other investment securities available for sale, taking advantage of high interest rate and 21.89 per cent growth in income from loans and advances to customers, caused gross earnings to up 17.89 per cent to N130.09 billion during this period compared to N110.35 billion in Q3 2016.

Though fee and commission income slide -13.60 per cent to N13.78 billion in Q3 2017 from N15.94 billion in the same period last year, weakened by -78.92 per cent drop in commission on E-banking activities to N1.33 billion from N6.31 billion in Q3 2016, other operating income leaped almost 100 per cent to N5.94 billion (Q3 2016: N2.98 billion), buoyed by net foreign exchange gains and dividend income, which rose 81.96 per cent and 1233.33 per cent respectively.
Fidelity Bank operating costs grew at a lower rate than revenue as interest and similar expenses was up 38.27 per cent to N56.56 billion and fee and commission cost climbed 24.86 per cent. Meanwhile, other operating cost was down -2.57 per cent to N47.49 billion in Q3 2017 on the back on -6.89 per cent drop in personnel expenses and marginal -3.01 per cent cut in marketing, communications and entertainment costs.
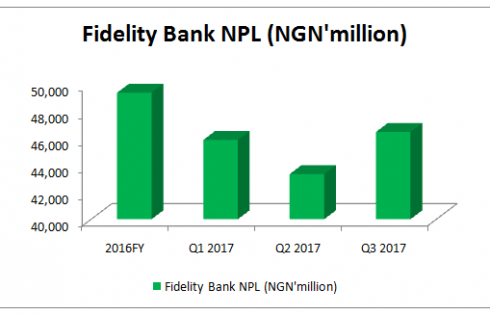
Lender’s impairment provision was sliced 8 per cent to N7.32 billion from N7.96 billion in Q3 2016, leading to its non-performing loan (NPL) ratio improving to 5.9 per cent in September 2017 from 6.6 per cent in December 2016. Consequently, coverage ratio rose to 97.3 per cent from 83 per cent at the end of 2016, though cost of risk was higher by 100 basis points from 1.2 per cent. The lender during its investor’s presentation on the Q3 2017 financial performance, promised to continue to focus on increasing collections and recoveries across the NPL book.
The lull in the economy caused total customer deposits of Fidelity Bank to decline marginally by 2.3 per cent to N774.4 billion from N793 billion in December 2016, but savings deposits was up 5.7 per cent to N163.8 billion in Q3 2017 from N155 billion in December 2016.
The bank’s loans and advances increased 3.40 per cent to N753.8 billion against N729.02 billion in the comparable period last year. The value of Fidelity Bank total asset shrank-4.89 per cent y-o-y to N1.33 trillion (Q3 2016: N1.4 trillion). Also, the lender’s total liabilities reduced -6.92 to N1.13 trillion during this period.